Everything you’ve heard about posting on LinkedIn is probably wrong.
We tested it on 196 creators, then on 1.94 million more posts to be sure. Documents win. Text is your weakest post. Video won't grow your reach. And polls are dead.
What goes viral · Part 1 of 4September 2026 · 5 min read

5×
Documents beat text
A typical document post gets 70 likes, comments and shares. A typical text post gets 14.
92%
Images beat text, for almost everyone
Compare each creator's own posts: images win 92% of the time. Documents win 87%.
1.2%
Documents rarely blow up
They're your floor, not your ceiling. Images are what the spikes come from.
−36%
Video views, down in a year
Company pages lost a third of their views per video from 2024 to 2025.
01 · The ranking
The typical post, by type
Ask ten LinkedIn coaches which post works best and you get ten confident answers and no numbers. So we counted. Every post from 196 creators, sorted by type, scored on likes, comments and shares. Then we checked on 1.94 million more.
Median engagement by format
11,717 posts · 196 creators · likes + comments + shares
Typical means the post in the middle when you line them all up, so one huge post can’t skew it. If you’re paying for a post, this is the result to plan on.
61%
of everything posted is an image
The type most people reach for by default, and for good reason.
21%
is text only
The easiest thing to write, and the lowest guaranteed return.
4.7%
of image posts go big
Against 1.2% of documents. Hoping for a breakout? Images are where it comes from.
0
polls that beat their author's usual post
We looked at 34. A typical poll got 8. Whatever boost polls once had is gone.
02 · Same likes, different reach
Two posts, the same likes. One was shared twice as much.
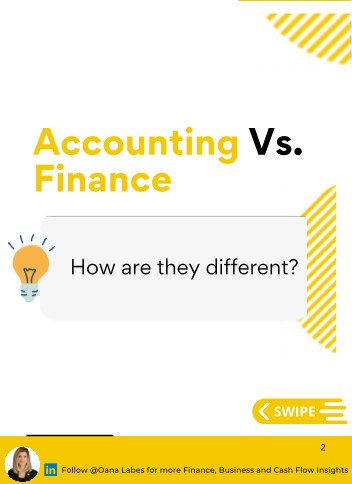
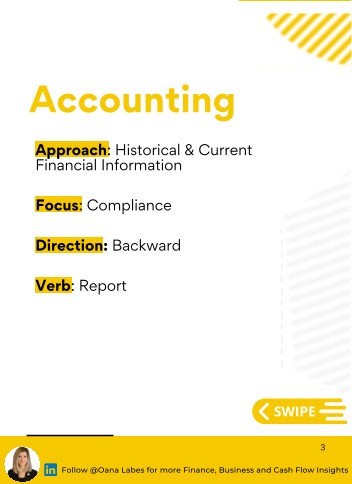
Two real posts from creators in our network got almost the same number of likes. One is a document, one is text. The document was shared 1,297 times. The text post, 653.

Oana Labes
oanalabes · 423K followers · 22 Feb 2023
Accounting and Finance are not the same.
They define value differently. They have different objectives. They have different perspectives. They require different technical skills.


Daniel Hemhauser
danielhemhauser · 99K followers · 4 Jun 2025
I don't care where you work.
I don't care if you start your day at 6 a.m. or 10 a.m.
I don't care if it's from a café, a home office, or a kitchen table.
I hired you because I trust you to get the job done.
A like reaches people who already saw it. A share reaches people who didn’t.
Same likes, twice the shares, so the document reached far more people than the text post did. That’s the number a brand is paying for.
03 · Why an image wins on a phone
The picture is the only thing that stops a thumb
Most people read LinkedIn on their phone. A text post shows three lines, then “see more”. A post with a picture fills the whole screen. For a second, it's the only thing they see.

Daniel Hemhauser
99K followers · text
I don’t care where you work.
I don’t care if you start your day at 6 a.m. or 10 a.m.
I don’t care if it’s from a café, a home office, or a kitchen table. …see more
Text post: three lines, then everyone else
Oana Labes
423K followers · document
Accounting and Finance are not the same. …see more
Document post: the whole screen
01
Put the point in the picture
It's the first thing people see. A chart or a screenshot beats a stock photo.
02
Look the same every time
Same face, same style, same colour. People recognise you before they read your name.
03
Write the first line for the phone
Only the first line or two show above the image. Make it count.
04 · Video
Video is losing views, not gaining them
Views per video dropped on company pages of every size between 2024 and 2025. That's the opposite of what “post more video” promises.
−36%
Views per video, on average
Company pages of every size, 2024 to 2025. Socialinsider's numbers.
−53%
At worst
Pages with 50 to 100K followers lost more than half their views per video.
↗
Still growing on personal profiles
Just slower than images. The collapse is a company-page problem.
If your growth plan is “post more video”, you’re chasing the one type that’s already losing.
05 · Checked again
1.94 million posts later, the order held
We ran the same test on everything we have, after removing job feeds and bots. Documents first, then images, then video, then text. Polls at the bottom again.
Our network
11,717 posts · 196 creators
- Documents70
- Images60
- Video45
- Text14
- Polls8
Everyone
1.94M posts · 9,882 creators
- Documents39
- Images29
- Video21
- Text6
- Polls6
We also compared each person only to their own other posts. The order still held. So it’s true for almost everyone, not just a few big accounts.
Good structure stops you losing. It doesn’t win you the lottery. A well-built post raises the worst it can do. It doesn’t change how often it blows up.
06 · What to do
Four simple rules
01
Post a document or carousel when you want a result you can count on.
Five times a text post, on the typical post.
02
Stop paying for polls.
They don't work anymore.
03
Post with a picture, and make it recognisably yours.
It's the only thing that stops a thumb.
04
Treat video as a creative choice, not a shortcut to reach.
It's the one type that's already losing views.
One cross-check. Two companies that sell LinkedIn tools published their own numbers. Socialinsider looked at 1.3 million posts, Buffer at over 52 million. Both found the same order: documents and carousels first, text near last. They rank video above images; we don’t. Their data is mostly company pages. Ours is people posting as themselves.
Sources · show
- 8x production database, 11,717 posts by 196 creators, queried 2 September 2026. Group posts excluded.
- 8x corpus check, September 2026: 8,301,657 posts by 13,262 accounts, cleaned to 1,941,394 posts by 9,882 creators. Each author capped at 400 posts. Within-author comparisons use creators with at least five posts in each format.
- Socialinsider, LinkedIn benchmarks 2026: 1.3M posts from 16,645 company pages, 2024 to 2025. Median views per native video by page size.
- Buffer, State of Social Media Engagement 2026: 52M+ posts to December 2025.
- Photographs: Pexels, free licence. The two posts and the document slides are public LinkedIn posts, linked above.